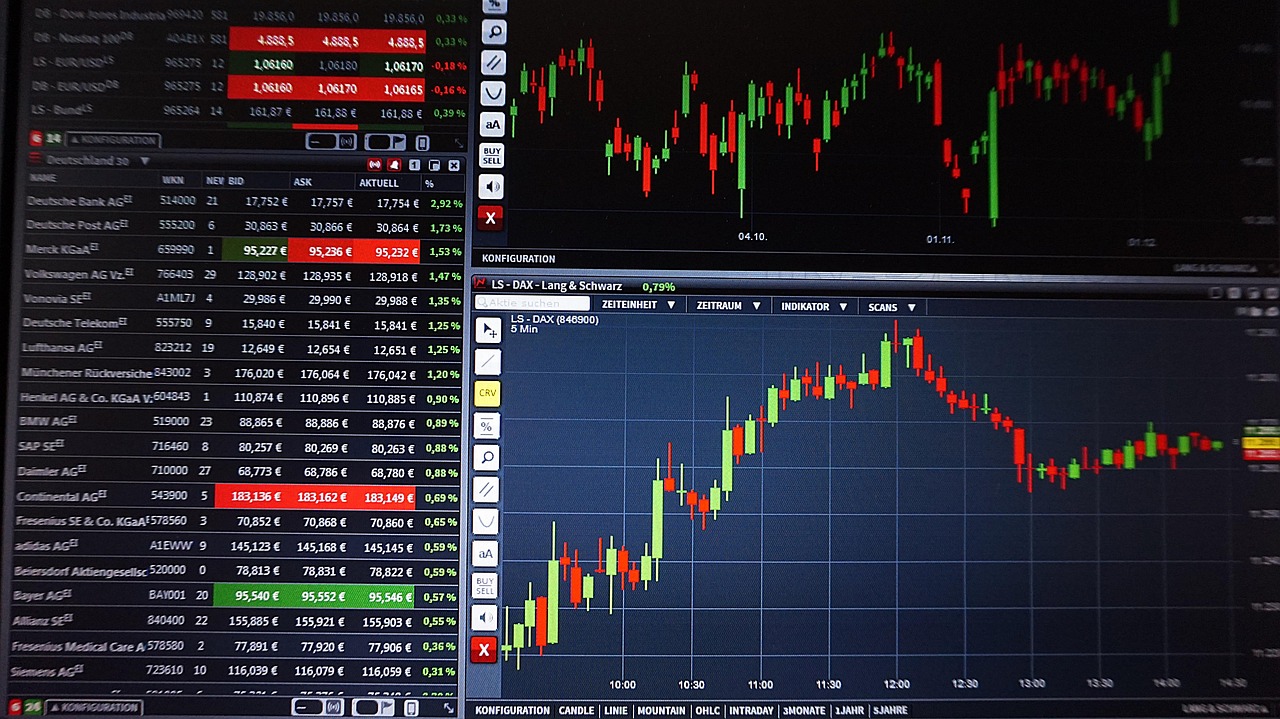
If you want to take your trading skills to the next level, you need to know how to read stock charts like a pro. In this guide, we’ll break down the essential elements of stock charts, explain different chart types, explore technical indicators, and give you actionable tips to improve your investing decisions.
When it comes to investing and trading, the stock chart is your best friend. Every movement of a company’s stock price tells a story, and the ability to read that story can mean the difference between profit and loss. For beginners, stock charts may look intimidating—full of lines, candlesticks, and technical indicators. But once you learn the basics, you’ll realize that reading stock charts is less about guessing and more about understanding the psychology of the market.
By the end, you’ll feel confident when you open a chart—no more confusion, just clear signals to help you trade smarter.
Table of Contents
Why Stock Charts Matter
Every investor looks at charts, from Wall Street professionals to retail traders using apps like Robinhood or Webull. Here’s why they’re so important:
- Visual Price History: Stock charts show how prices have moved over time.
- Spotting Trends: You can see if a stock is in an uptrend, downtrend, or sideways movement.
- Support & Resistance Levels: Charts help identify price zones where a stock tends to bounce or reverse.
- Timing Entries & Exits: Technical analysis indicators can guide when to buy or sell.
Simply put, if you know how to read stock charts like a pro, you gain a huge advantage over traders who rely on guesswork or emotions.
Types of Stock Charts

Before we dive deeper, let’s look at the three most common chart types you’ll encounter.
1. Line Chart
- Simplest type of chart.
- Connects closing prices over a period of time.
- Great for beginners to see overall trends.
2. Bar Chart
- Shows open, high, low, and close prices (OHLC).
- Gives more detail than a line chart.
- Useful for spotting volatility.
3. Candlestick Chart (Most Popular)
- Displays the same info as bar charts but in a visual format.
- Green candles = price went up, Red candles = price went down.
- Widely used by professional traders.
👉 If you want to truly learn how to read stock charts like a pro, start with candlestick charts. They provide the most insights at a glance.
Key Elements of Stock Charts
1. Timeframes
Charts can show different timeframes:
- 1-Minute Charts – For day traders.
- Daily Charts – Most popular for swing traders.
- Weekly/Monthly Charts – Long-term investors.
The same stock may look bullish on a daily chart but bearish on a monthly chart. That’s why understanding multiple timeframes is essential if you want to read stock charts like a pro.
2. Price Axis (Y-Axis)
Shows the stock price level. Higher prices indicate demand, lower prices indicate selling pressure.
3. Volume Bars
At the bottom of most charts, you’ll see volume bars. High volume = strong buying or selling activity. Low volume = weak interest.
Pro Tip: Rising prices with strong volume = bullish. Falling prices with strong volume = bearish.
4. Moving Averages
A moving average smooths out price data.
- 50-day Moving Average: Short to mid-term trend.
- 200-day Moving Average: Long-term trend.
When the 50-day crosses above the 200-day (Golden Cross), it’s bullish. When it drops below (Death Cross), it’s bearish.
5. Support & Resistance
- Support: A level where the stock tends to stop falling.
- Resistance: A level where the stock struggles to go higher.
Common Chart Patterns
Patterns form because human behavior tends to repeat in markets. Some key patterns include:
- Head and Shoulders: Signals reversal.
- Double Top/Bottom: Indicates major turning points.
- Triangles (Ascending/Descending): Shows consolidation before breakout.
- Cup and Handle: Often bullish continuation.
Learning these patterns is critical if you want to practice how to read stock charts like a pro.
Technical Indicators That Pros Use
While price and volume are the core, indicators provide deeper insights.
1. Relative Strength Index (RSI)
- Measures momentum.
- Above 70 = overbought (possible sell).
- Below 30 = oversold (possible buy).
2. MACD (Moving Average Convergence Divergence)
- Tracks momentum shifts.
- A bullish crossover happens when MACD line crosses above the signal line.
3. Bollinger Bands
- Shows volatility.
- When prices move close to the upper band = possible overbought.
- Near the lower band = possible oversold.
4. Fibonacci Retracements
- Used to predict support/resistance based on percentage pullbacks.
Steps: How to Read Stock Charts Like a Pro

Let’s put it all together into a step-by-step guide:
- Choose Your Chart Type: Start with candlestick charts.
- Set the Right Timeframe: Daily for swing trading, weekly for investing.
- Check Overall Trend: Is the stock trending up, down, or sideways?
- Identify Support & Resistance: Mark key price levels.
- Look at Volume: Confirm trends with trading activity.
- Add Moving Averages: Spot long-term momentum.
- Use Indicators (RSI, MACD, Bollinger Bands): Validate signals.
- Watch for Chart Patterns: Look for breakouts or reversals.
- Combine Multiple Signals: Don’t rely on one indicator alone.
- Stay Disciplined: Never let emotions overrule the chart.
Mistakes Beginners Make
- Relying on one indicator only.
- Ignoring volume confirmation.
- Trading on emotion instead of data.
- Overloading charts with too many tools.
- Forgetting to check multiple timeframes.
Real-World Example
Imagine Tesla (TSLA) stock:
- Daily candlestick chart shows higher lows = uptrend.
- RSI is above 65 = near overbought.
- Volume rising with price = strong bullish move.
- Resistance at $300.
A pro trader would likely wait for a breakout above $300 on strong volume before entering.
Endline
Learning How to Read Stock Charts like a Pro is one of the most valuable skills for any investor or trader. Charts are not just lines and numbers—they’re a visual story of Market psychology, fear, and greed.
By understanding chart types, recognizing support and resistance, mastering patterns, and applying technical indicators, you’ll gain a competitive edge. Remember: the chart doesn’t lie—it reflects real buying and selling pressure.
The more you practice, the better you’ll become at spotting opportunities before the crowd. And when you can confidently say you know how to read stock charts like a pro, you’ll unlock smarter, data-driven investing decisions for the rest of your life.


